Observability for Vibe-Coded Systems: Logging, Metrics, and Tracing Guide
 Apr, 5 2026
You've probably heard the term "vibe coding." It's that flow where you prompt an AI to build a massive feature, hit 'apply,' and the code just... works. Or at least it seems to. But here is the scary part: when you're shipping thousands of lines of AI-generated code that you haven't personally read line-by-line, you're essentially flying blind. Traditional manual code reviews are too slow for this pace, and they're often skipped. This is where Observability is the practice of measuring the internal state of a system by examining its external outputs to understand why something is happening in production. In the world of vibe coding, observability isn't just a "nice to have"-it's your only safety net. It's the replacement for the manual review process.
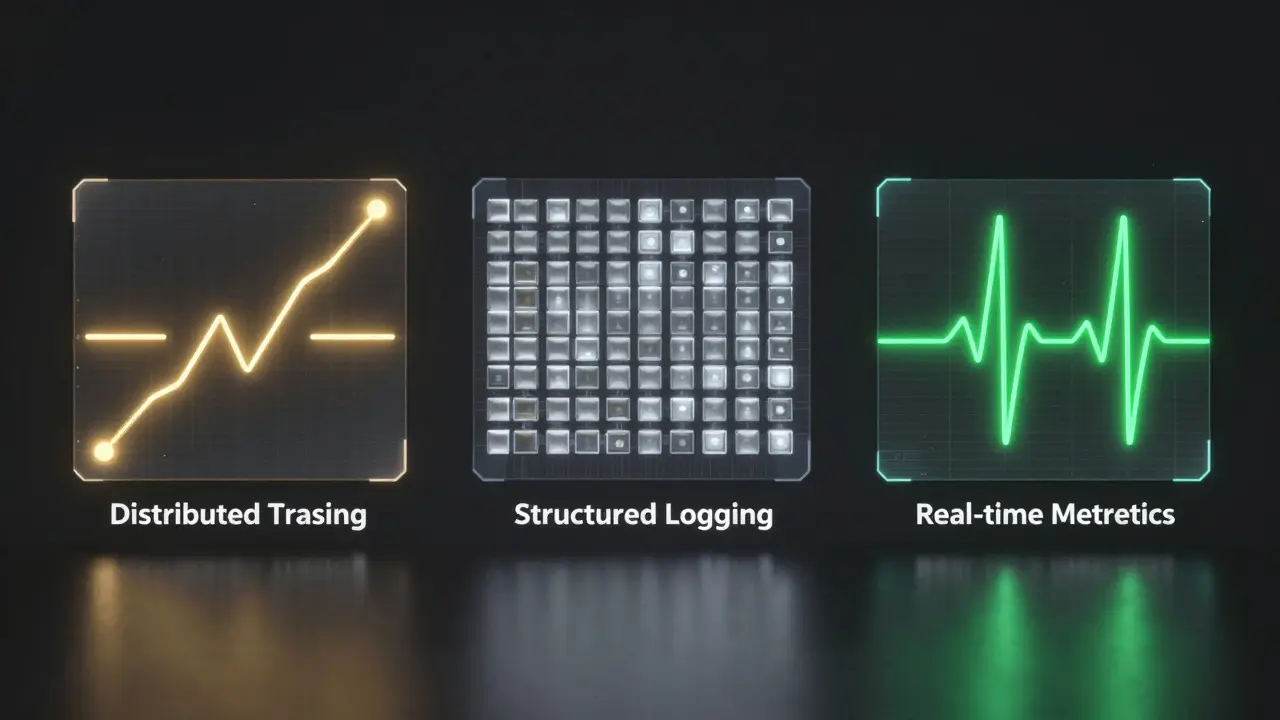
The Three Pillars of AI-Native Monitoring
When AI writes your code, it might introduce a logic bug that doesn't crash the app but makes it painfully slow. To catch this, you need three specific signals working together. If you miss one, you're guessing; if you have all three, you're diagnosing.
- Distributed Tracing: This is your map. Distributed Tracing tracks a single request as it travels through your entire stack. For vibe-coded apps, this is a lifesaver for spotting "N+1 query problems"-where the AI accidentally tells the app to make 100 database calls instead of one. You can see exactly where the bottleneck is without hunting through files.
- Structured Logging: Stop using
console.log("here"). You need logs that are machine-readable. Structured Logging attaches context like user IDs, IP addresses, and error types to every event. Imagine an authentication failure happens. Instead of spending hours trying to reproduce it locally, you filter your logs for that specificuser_idand see the exact failure path in 30 seconds. - Real-time Metrics: These are your vitals. Metrics tell you the pattern of what's happening. While a log tells you a specific user had an error, a metric tells you that 15% of all users are suddenly experiencing 500ms slower response times. This allows you to catch memory leaks or performance regressions before they become full-scale outages.
Standardizing with OpenTelemetry
You don't want to be locked into a single vendor's proprietary agent. That's why OpenTelemetry has become the gold standard. It's a vendor-neutral framework for collecting telemetry data. Because most vibe-coding tools now support it, you can automatically instrument your Express middleware, HTTP libraries, and database layers like Prisma or Sequelize without writing the boilerplate yourself.
By using a standardized approach, you can switch your backend-moving from a startup-friendly tool to an enterprise giant like Dynatrace-without touching a single line of your instrumentation code. It ensures that no matter how the AI evolves the codebase, the way you measure it remains consistent.
| Feature | OpenTelemetry (Std) | VictoriaMetrics Stack | Dynatrace |
|---|---|---|---|
| Role | Data Collection | Unified Backend | Enterprise Analysis |
| Vendor Lock-in | None | Low | Moderate |
| Key Strength | Interoperability | High Performance/Cost | AI-Driven Insights |
Managing the Cost of AI: Token Observability
Vibe coding introduces a new type of "leak": the financial leak. If your AI-generated functions are sending massive prompts to a model, your API bill will explode. You need to monitor token usage as a first-class metric. Specifically, you should be tracking input tokens, output tokens, and cached tokens.
For example, Claude is currently one of the few models that exposes cost metrics directly through telemetry. By monitoring cache efficiency, you can see if your prompt engineering is actually saving money or if you're paying for the same context over and over. If you see a spike in token consumption for a specific feature, you know exactly where the AI-generated logic is being too verbose.
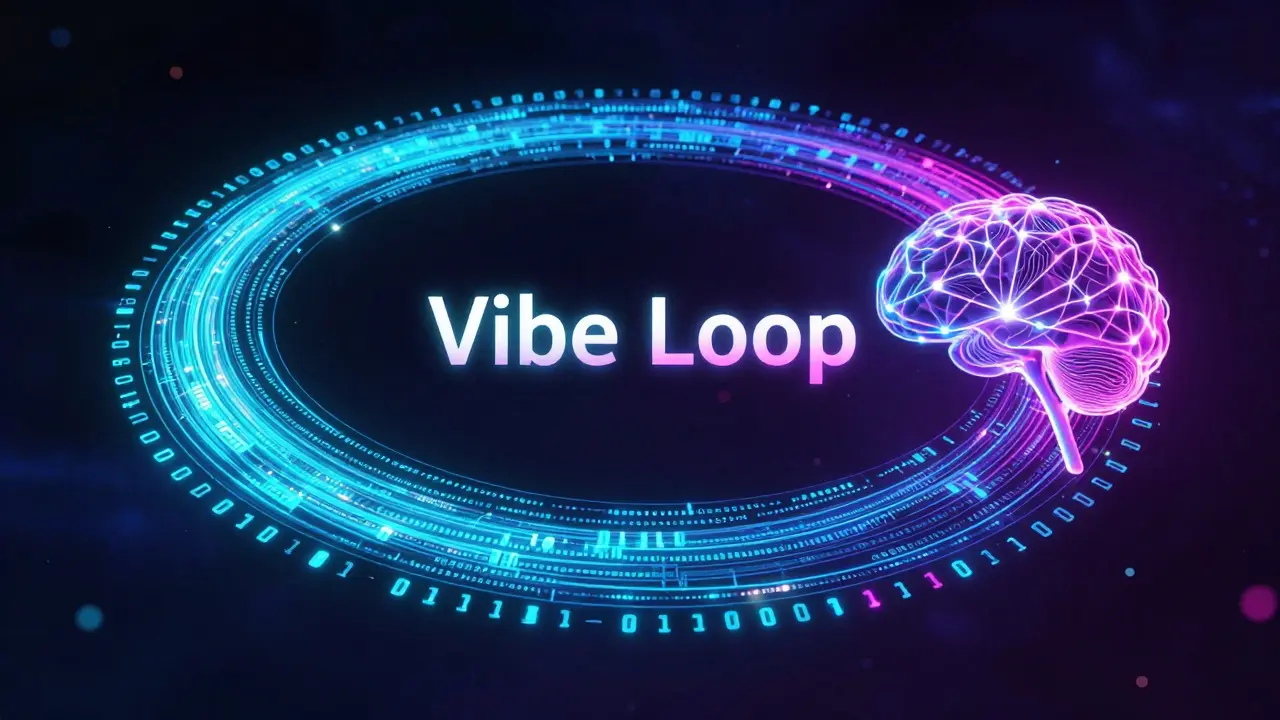
Building the "Vibe Loop" for Debugging
The real magic happens when you create a closed-loop system. Instead of reading a log and then manually telling the AI what's wrong, you feed the telemetry data-traces, logs, and error metrics-directly back into the model. This is the vibe loop.
When the AI has vision capabilities and access to the actual trace of a failed request, it doesn't need you to describe the bug. It can see that the database query took 4 seconds and the authentication middleware timed out. This dramatically accelerates the fix cycle and makes the system self-improving. The observability data becomes the training set for the next version of the code.
Common Pitfalls to Avoid
Most developers make the mistake of "logging everything." That's a recipe for noise. The goal isn't more data; it's higher-value data. Avoid these traps:
- The Production-Only Test: Never wait until the code is in production to see if your logs work. In your development environment, deliberately break things. If you can't find the bug in your local logs and traces, you'll never find it in production.
- The console.log Habit: As mentioned, unstructured strings are useless for querying. If you're prompting an AI to write a feature, tell it explicitly: "Use structured logging with severity levels. Never use console.log."
- Ignoring the Critical Path: Don't spend time instrumenting a CSS change. Focus your observability on the critical paths: payment flows, authentication, and heavy database operations.
Implementation Checklist for Vibe Coders
If you're starting a new project today, don't retrofit observability later. Do it from day one. Here is a quick rule of thumb for your AI prompts:
- Define the Schema: Tell the AI which fields every log must have (e.g.,
request_id,user_id,timestamp). - Demand Tracing: Require that every external API call be wrapped in a trace span.
- Set Baselines: Define what a "normal" response time looks like so your metrics can alert you to anomalies.
- Validate Locally: Verify that error cases emit the correct telemetry before you merge the PR.
What is the difference between monitoring and observability?
Monitoring tells you that something is broken (e.g., "The CPU is at 99%" or "The site is down"). Observability tells you why it is broken by allowing you to explore the system's internal state through logs, metrics, and traces without needing to deploy new code to add more print statements.
Why is OpenTelemetry preferred over vendor-specific tools?
OpenTelemetry provides a universal standard for telemetry. If you use a vendor-specific agent and that company raises prices or goes out of business, you have to rewrite all your instrumentation. With OpenTelemetry, you just change the destination (the exporter) where the data is sent, keeping your code clean and portable.
How does vibe coding change the way we handle QA?
In traditional coding, you review the code to find bugs. In vibe coding, the volume of AI-generated code is too high for a human to review every line. Observability shifts the focus from preventing bugs through review to detecting and resolving them instantly through real-time data.
What are the key components of the VictoriaMetrics stack?
The stack includes VictoriaMetrics for high-performance time-series metrics, VictoriaLogs for efficient log storage and querying, and VictoriaTraces for visualizing the flow of distributed requests. Together, they provide a complete, cost-effective backend for telemetry.
Can observability actually help the AI write better code?
Yes, via the "vibe loop." When you feed actual production traces and error logs back into the AI, the model doesn't have to guess why a bug is happening. It sees the exact state and timing of the failure, allowing it to generate a much more accurate fix.
sumraa hussain
April 6, 2026 AT 17:15this is actually wild... the idea of a vibe loop is just insane!!!! imagine the chaos if the AI just loops errors back into itself and creates a digital death spiral!!!
Raji viji
April 7, 2026 AT 12:33Lmao calling it "vibe coding" is just a fancy way to say you're too lazy to actually learn how to program. Now we're just paying for expensive telemetry tools to find the garbage the AI left behind. Absolute circus.
Vishal Bharadwaj
April 8, 2026 AT 09:31honestly op is just repeating the otelem marketing brochure here... most of these "vibe loops" just result in the AI hallucinating a fix based on a trace it doesn't even understand. its all just buzzwords and hype to hide the fact that the code is spaghetti anyway. total joke lol.
Rubina Jadhav
April 10, 2026 AT 06:25This helps a lot. I will try to use structured logs now.
Rajashree Iyer
April 11, 2026 AT 20:45We are witnessing the death of the artisan coder and the birth of the digital overseer! It is a tragedy of the highest order that we no longer read the poetry of the logic, but instead stare at cold, heartless metrics to see if our creation is breathing! We have traded the soul of the craft for the efficiency of the machine, and in doing so, we have become mere ghosts in our own systems, drifting through traces and spans like lost spirits searching for a bug that has no name!
Parth Haz
April 13, 2026 AT 17:04It is truly encouraging to see such a structured approach to AI development. Integrating OpenTelemetry from day one is a professional standard that will undoubtedly save many teams from avoidable disasters in the future.