Logging and Observability for Production LLM Agents: A Practical Guide
 Nov, 16 2026
You deployed your Large Language Model agent to production last week. It looked perfect in staging. But now users are complaining about weird answers, costs are spiking, and you have no idea why. Sound familiar? This is the reality of running autonomous AI systems. Traditional monitoring tools-CPU usage, memory, HTTP status codes-tell you the server is alive. They tell you nothing about whether the agent understood the user, hallucinated a fact, or wasted 50,000 tokens trying to solve a simple problem.
LLM observability isn't just another buzzword; it's the difference between a product that works and one that breaks trust. Unlike standard software, agents are non-deterministic. The same input can produce different outputs based on subtle context shifts. You can't just set an alert for "error rate > 1%" because a successful API call might still return a completely wrong answer. To fix this, you need to log the reasoning, not just the result.
Why Standard Monitoring Fails for Agents
Think about a traditional web app. If a database query fails, you get a 500 error. Easy to spot. Now look at an Agentic System. The agent calls a tool, gets a valid JSON response, formats it nicely, and returns it to the user. Status code? 200 OK. Latency? 400ms. All green lights. But if the agent retrieved the wrong document from your vector store or misunderstood the user's intent, the system looks healthy while failing silently.
This gap creates dangerous blind spots. Industry analysis from AWS Prescriptive Guidance highlights that agentic systems require observability beyond traditional metrics because autonomous agents make decisions that create variable execution paths. You aren't just watching infrastructure; you're watching cognition. Did the agent decide to use a search tool when it should have used a calculator? Did it loop three times before giving up? These semantic signals are invisible to Prometheus or Datadog unless you specifically instrument them.
The core distinction lies here: monitoring asks "Is the system up?" while observability asks "Is the system thinking correctly?" For LLMs, the latter matters far more. A slow response is annoying; a hallucinated legal advice snippet is catastrophic.
The Three Surfaces of Agent Logging
To capture what's actually happening inside your agent, you need a structured approach. Research frameworks like AgentTrace propose a three-surface taxonomy for logging: cognitive, operational, and contextual. This isn't just academic theory-it's a practical blueprint for what you need to save to your logs.
- Cognitive Surface: This captures the agent's "thought process." What was the chain-of-thought? Why did it choose this tool over another? Was there self-correction?
- Operational Surface: The nuts and bolts. Token counts, latency per step, API errors, and cost per interaction.
- Contextual Surface: The environment. What data was retrieved? What was the conversation history? Which version of the model was used?
If you only log the final output, you lose the ability to debug. Imagine a user says, "Book me a flight to Paris." The agent books a flight to Paris, Texas. Your operational logs show success. Your cognitive logs would reveal the agent failed to disambiguate "Paris" despite having access to location context. Without that cognitive trace, you'd never know to add a clarification step.
Building Your Tech Stack with OpenTelemetry
You don't need to build a custom logging pipeline from scratch. The industry has converged on OpenTelemetry as the standard for collecting traces. It allows you to capture sequences of events across your entire stack-from the user's click to the LLM API call to the database lookup.
Here’s how to wire it up effectively:
- Instrument the Entry Point: Create a unique trace ID for every user session. This links all subsequent steps together.
- Wrap LLM Calls: Use spans to record the prompt sent, the raw completion received, token usage (input/output), and model version. Don't just log the text; log the metadata.
- Track Tool Executions: Every time your agent calls a function (e.g., `search_web` or `query_sql`), create a child span. Log the arguments passed and the result returned.
- Export to a Visualizer: Send these traces to a backend like Jaeger, Grafana Tempo, or specialized platforms like LangSmith.
Using JSON formatters for your logs is critical. Unstructured text logs are hard to query at scale. Structured JSON lets you run queries like "Show me all requests where `tool_calls_count > 3` AND `final_answer_length < 50`." This helps you spot inefficient agents that ramble or get stuck in loops.

Quality Evaluation in Real-Time
Logs are useless if you don't evaluate them. You need automated checks that run against production traffic. This is where Automated Evaluations come in. Instead of manually reading thousands of logs, you deploy lightweight evaluators that score each interaction.
Common evaluation metrics include:
| Metric | What It Measures | Why It Matters |
|---|---|---|
| Hallucination Rate | Factual accuracy vs. source data | Prevents misinformation in high-stakes domains |
| Tool Success Rate | % of tool calls returning valid data | Identifies broken integrations or bad prompts |
| Token Efficiency | Tokens used per task completion | Directly impacts cost and latency |
| Relevance Score | Semantic similarity to user query | Detects drift or poor retrieval quality |
For example, if you're using Retrieval-Augmented Generation (RAG), you should automatically check if the retrieved documents actually contained the answer. If the relevance score drops below a threshold, flag that trace for human review. Tools like LangChain's LangSmith allow you to set up these feedback loops directly in your dashboard, turning raw logs into actionable insights.
Debugging Multi-Agent Systems
Things get messy when you move from single agents to multi-agent architectures. In a multi-agent setup, one agent might hand off work to another. If the final output is wrong, which agent messed up? Did Agent A provide bad context to Agent B? Or did Agent B misinterpret good context?
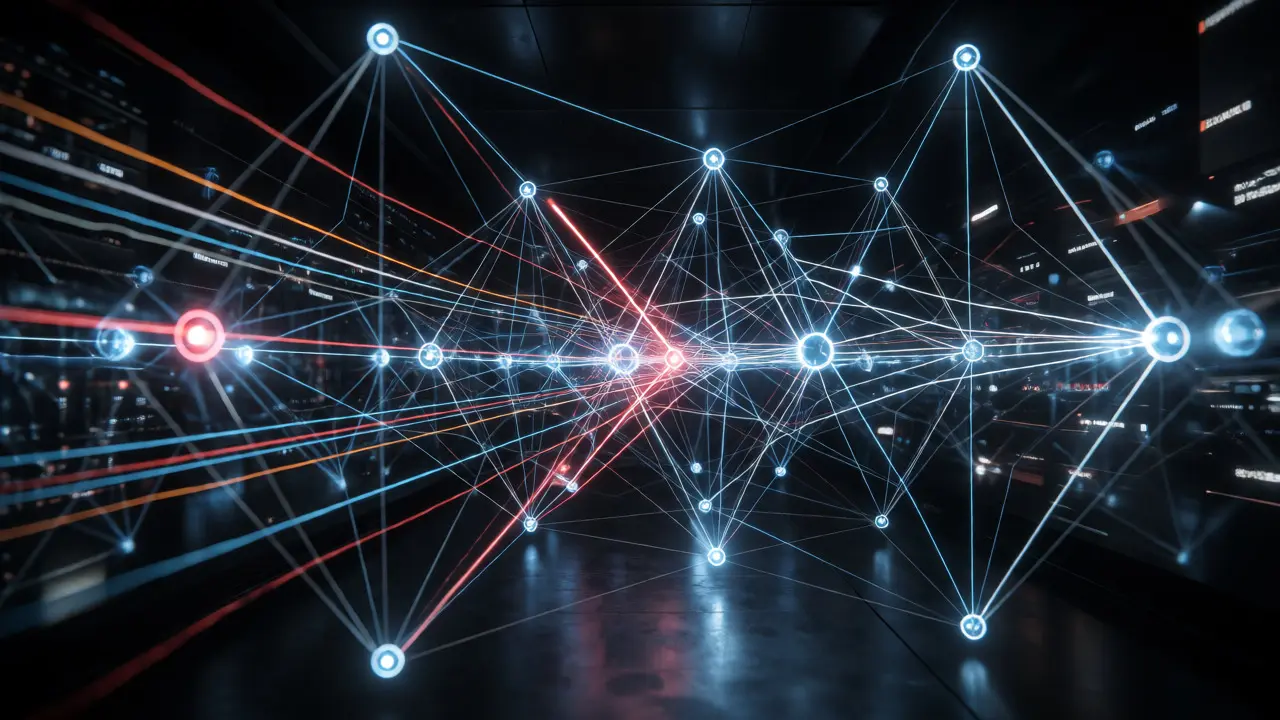
You need trajectory-level tracing. This means visualizing the entire graph of interactions. When debugging, look for cascading errors. Databricks research identifies tool-related failures as the most common category of production agent failures. Often, a minor error in an early tool call propagates through the chain, causing a total failure minutes later. By linking traces via parent-child relationships, you can pinpoint the exact moment the logic broke.
A pro tip: implement "handoff logs." When Agent A passes control to Agent B, explicitly log the summary of what was passed. This prevents ambiguity during debugging. If Agent B says "I didn't receive the user's name," you can check the handoff log to see if Agent A actually included it.
The Continuous Improvement Loop
Observability isn't just for fixing bugs; it's for improving your product. The best teams treat production logs as a goldmine for training data. Here is a workflow that turns observability into growth:
- Discover: Use clustering algorithms on your production queries to find new topics users are asking about. Maybe everyone is suddenly asking about "refund policies" after a recent change.
- Annotate: Push low-scoring or anomalous traces into an annotation queue. Have humans label them as "good," "bad," or "needs improvement."
- Dataset Creation: Add these labeled examples to your regression test suite.
- Experiment: Test prompt changes or new models against this dataset offline.
- Deploy: Roll out the fix and monitor the same metrics to ensure it worked.
This loop closes the gap between development and production. You stop guessing what users want and start seeing it. Over time, your agent becomes more robust because you're constantly feeding real-world edge cases back into your testing pipeline.
Pitfalls to Avoid
Even with great tools, teams often stumble. Here are common mistakes:
- Logging Everything: Storing every intermediate thought for every request can explode storage costs. Sample your logs. Keep full traces for errors and random samples, but aggregate metrics for successful happy paths.
- Ignoring Privacy: LLM prompts often contain PII (Personally Identifiable Information). Ensure your logging pipeline masks sensitive data before storing it, especially if you're sending logs to third-party vendors.
- Static Dashboards: Your agent's behavior changes as you update prompts. Update your dashboards regularly. A metric that was important last month might be irrelevant today.
Start small. Instrument your first prototype. Don't wait until you have 10,000 users to figure out how to debug. Build evaluation baselines early, so when things break in production, you already know what "normal" looks like.
What is the difference between monitoring and observability for LLMs?
Monitoring tracks system health metrics like uptime, latency, and error rates (e.g., HTTP 500s). Observability focuses on the semantic quality of the AI's output, such as hallucination rates, factual accuracy, and reasoning validity. While monitoring tells you if the server is working, observability tells you if the AI is thinking correctly.
Do I need special tools for LLM observability?
While general-purpose tools like Prometheus and Grafana can handle basic metrics, specialized platforms like LangSmith, Weights & Biases, or Arize Phoenix offer features tailored for LLMs, such as prompt versioning, token cost tracking, and semantic evaluation. Using OpenTelemetry standards allows you to integrate these specialized tools with existing infrastructure.
How do I debug a multi-agent system?
Use distributed tracing to visualize the flow of data between agents. Assign unique trace IDs to each user session and link individual agent actions as child spans. Look for handoff points where context is passed between agents, as this is where information loss or misinterpretation frequently occurs.
What is the biggest risk of poor LLM logging?
The biggest risk is silent failure. An agent can return a confident but incorrect answer with a 200 OK status code. Without detailed logging of the reasoning chain and retrieved context, you won't detect these errors until users complain, leading to potential reputational damage and compliance issues.
How does RAG impact observability requirements?
RAG systems require specific observability into the retrieval step. You must log which documents were retrieved, their relevance scores, and how they influenced the final generation. Poor retrieval is a common cause of hallucinations, so tracking retrieval quality separately from generation quality is essential for effective debugging.